VISUALIZING IN THE MESSYVERSE
(With Halvor Halvorson and Jessica Santone)
2023
In this collaborative art-science project, the participants envisioned and suggested alternative data visualization and data storytelling approaches within the realm of water quality research. Converging the disciplines of art, art history, water quality research, chemistry, and ecology, discussions revolved around the methods employed for acquiring, accessing, analyzing, and presenting water quality data. Throughout these discussions, the diverse experiences, work procedures, and methodologies of artists, art historians, and research scientists emerged, allowing for comparisons. The central inquiries posed in each discussion prompted further questioning, the exchange of information, and the creation of narratives.
Emergent themes from these conversations include:
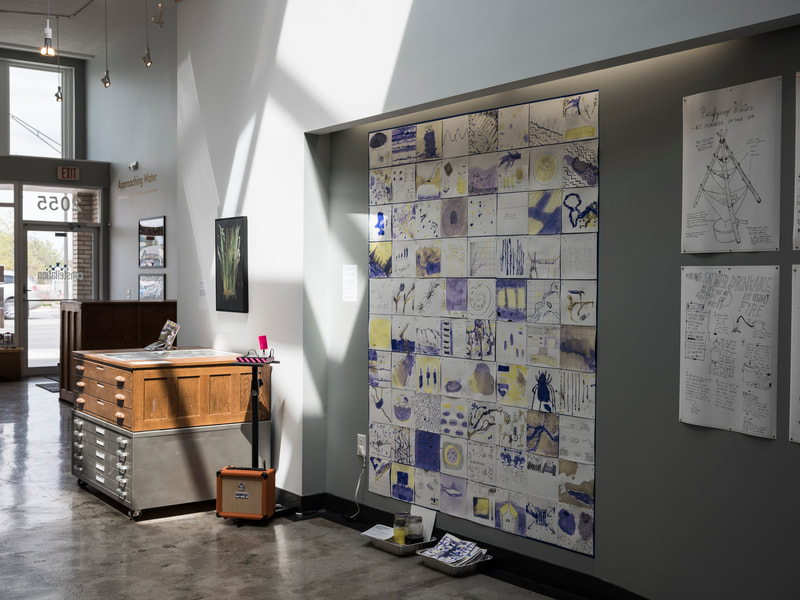
An outcome of these conversations was a participatory artwork in the form of a workshop and installation.
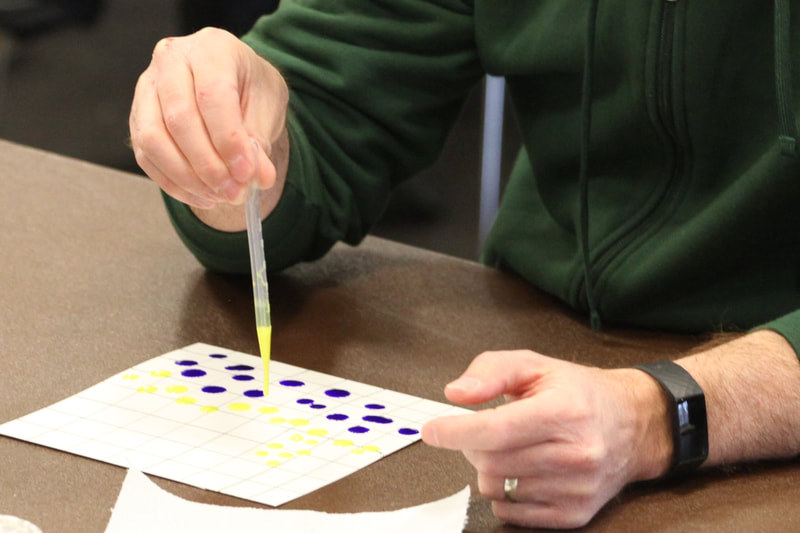
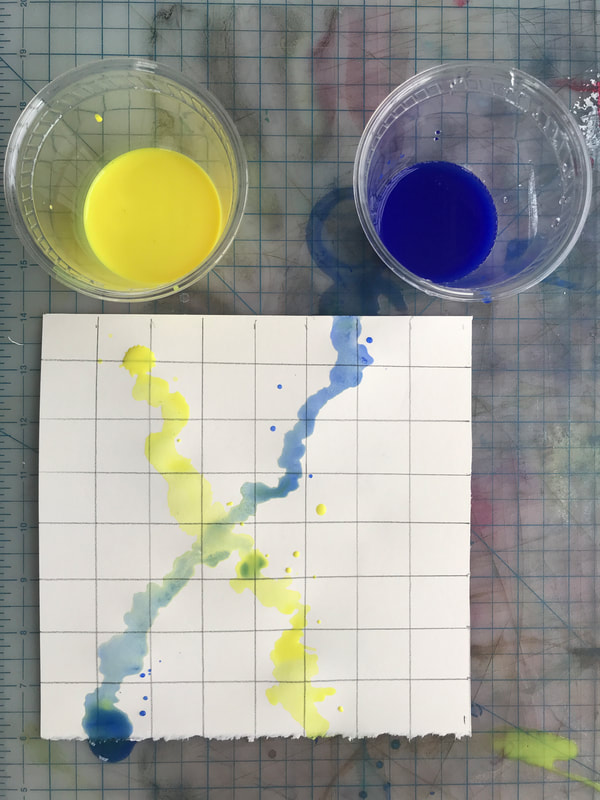
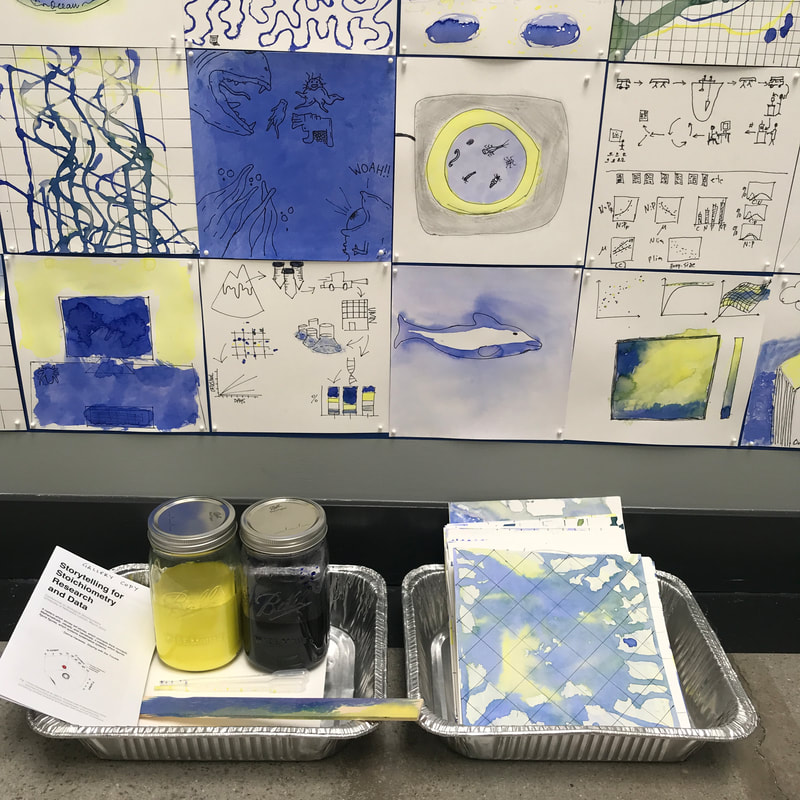
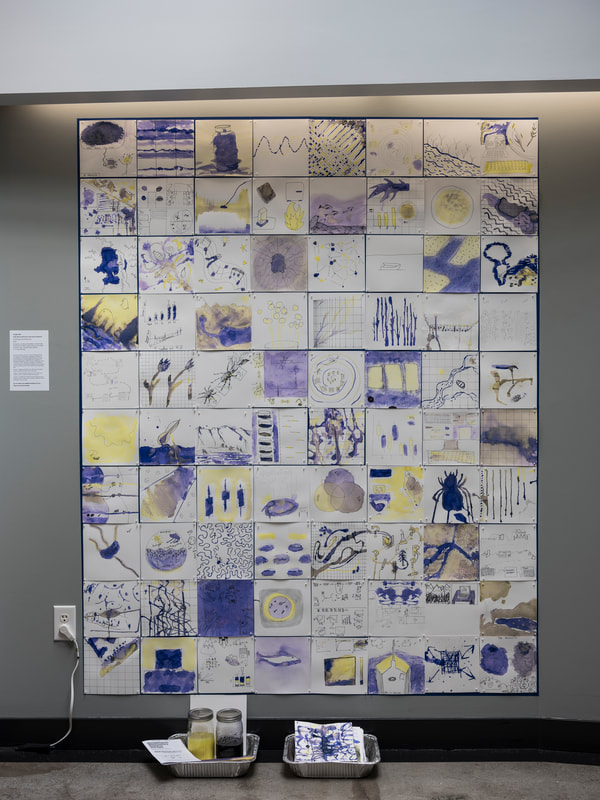
Participatory workshop and installation of mixed media drawings and workshop supplies (aluminum trays, liquid watercolor, ruler, watercolor paper, pipettes)
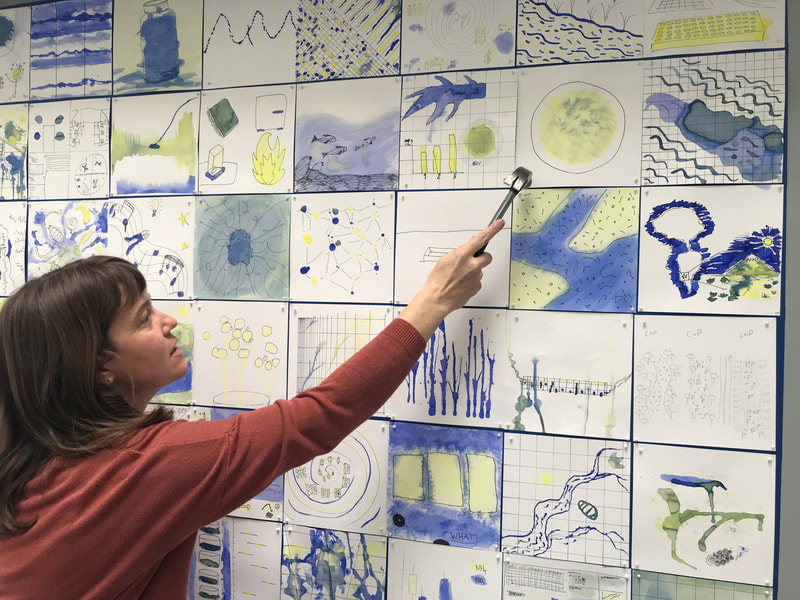
8” x 8” each drawing
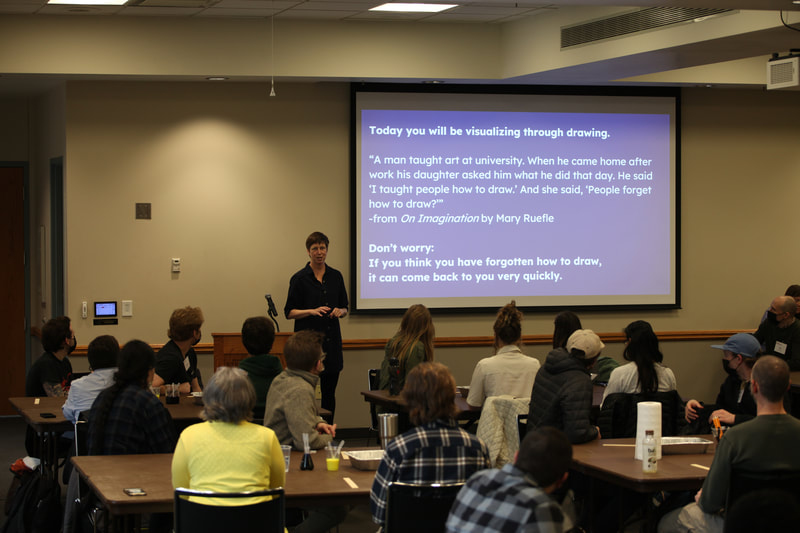
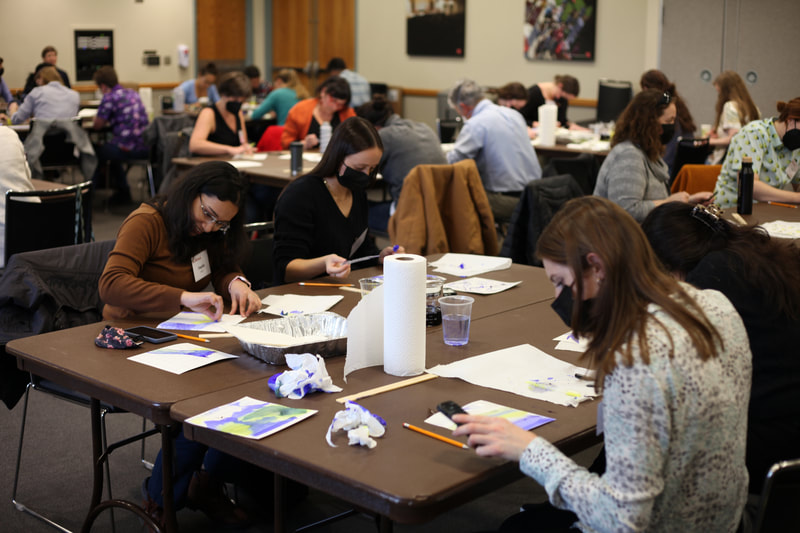
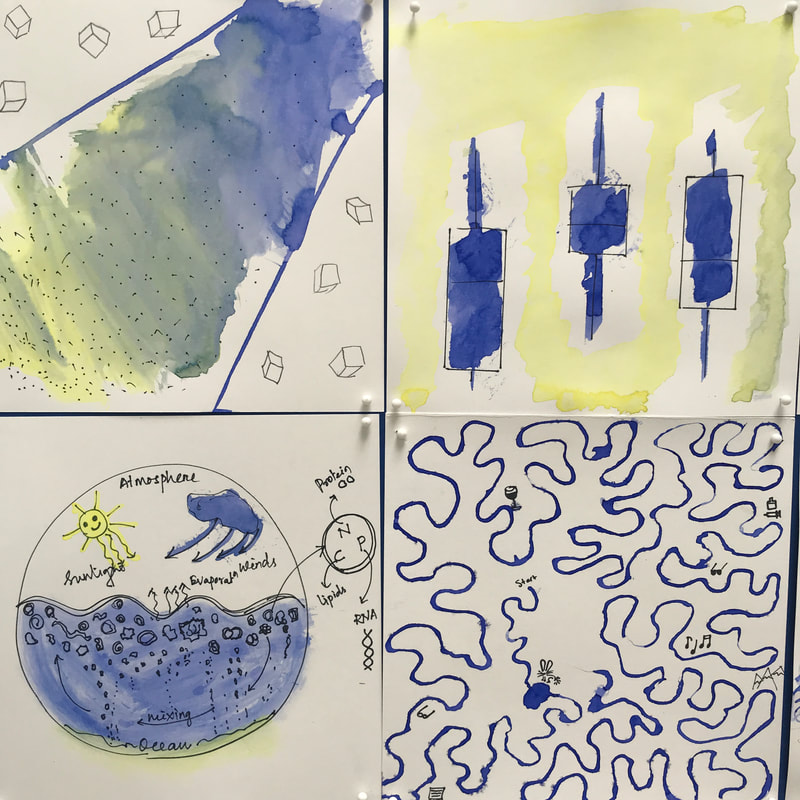
The grid of drawings and trays of materials displayed are remnants of a participatory pedagogical workshop on “Storytelling for Stoichiometry Research and Data” hosted by Jessica Santone and Vaughn Bell at the Conference on Biological Stoichiometry at the University of Nebraska–Lincoln on March 21, 2023. Attendees responded to the following scored instructions, prompting reconsideration of the normative ways that scientists report on their research and visualize their data:
Chapter 1. Make a grid. Tell a story with water and science research materials. Notice how the water flows.
Chapter 2. Picture the place where you work. Notice your choices in what to include and what scale to depict.
Chapter 3. Visualize your research. Draw the process of your research; draw the results of your research. Notice how time is portrayed in your drawings.
Other collaborators include: Linnea Rock, Casey Brucker, Erin Larson, as well as Katie Anania, Dorota Biczel, and Cooper Stiglitz.
Visualizing in the Messyverse was created through the Art, Data Environments program of the Stoich project https://stoichproject.wordpress.com/stoich/the-stoich-project/ at the Conference on Biological Stoichoimetry.
For more projects like this, visit the Art-Science page.
2023
In this collaborative art-science project, the participants envisioned and suggested alternative data visualization and data storytelling approaches within the realm of water quality research. Converging the disciplines of art, art history, water quality research, chemistry, and ecology, discussions revolved around the methods employed for acquiring, accessing, analyzing, and presenting water quality data. Throughout these discussions, the diverse experiences, work procedures, and methodologies of artists, art historians, and research scientists emerged, allowing for comparisons. The central inquiries posed in each discussion prompted further questioning, the exchange of information, and the creation of narratives.
Emergent themes from these conversations include:
- Curiosity is the starting point for cross-disciplinary conversation.
- Tools and materials are integral to water quality research and art processes.
- Data visualizations leave out most experiential and place-based aspects of water quality research and understanding; art methods and techniques can open up possibilities for wider noticing and deeper connections to places.
- Scientific research, like art processes, is often messy.
An outcome of these conversations was a participatory artwork in the form of a workshop and installation.
Participatory workshop and installation of mixed media drawings and workshop supplies (aluminum trays, liquid watercolor, ruler, watercolor paper, pipettes)
8” x 8” each drawing
The grid of drawings and trays of materials displayed are remnants of a participatory pedagogical workshop on “Storytelling for Stoichiometry Research and Data” hosted by Jessica Santone and Vaughn Bell at the Conference on Biological Stoichiometry at the University of Nebraska–Lincoln on March 21, 2023. Attendees responded to the following scored instructions, prompting reconsideration of the normative ways that scientists report on their research and visualize their data:
Chapter 1. Make a grid. Tell a story with water and science research materials. Notice how the water flows.
Chapter 2. Picture the place where you work. Notice your choices in what to include and what scale to depict.
Chapter 3. Visualize your research. Draw the process of your research; draw the results of your research. Notice how time is portrayed in your drawings.
Other collaborators include: Linnea Rock, Casey Brucker, Erin Larson, as well as Katie Anania, Dorota Biczel, and Cooper Stiglitz.
Visualizing in the Messyverse was created through the Art, Data Environments program of the Stoich project https://stoichproject.wordpress.com/stoich/the-stoich-project/ at the Conference on Biological Stoichoimetry.
For more projects like this, visit the Art-Science page.
